A Belgian business intelligence hackathon in Antwerp
Hogeschool Utrecht took its Master of Informatics cohort to Antwerp for two days on Data.be's decade of Belgian company records, judged by a jury on the second afternoon.
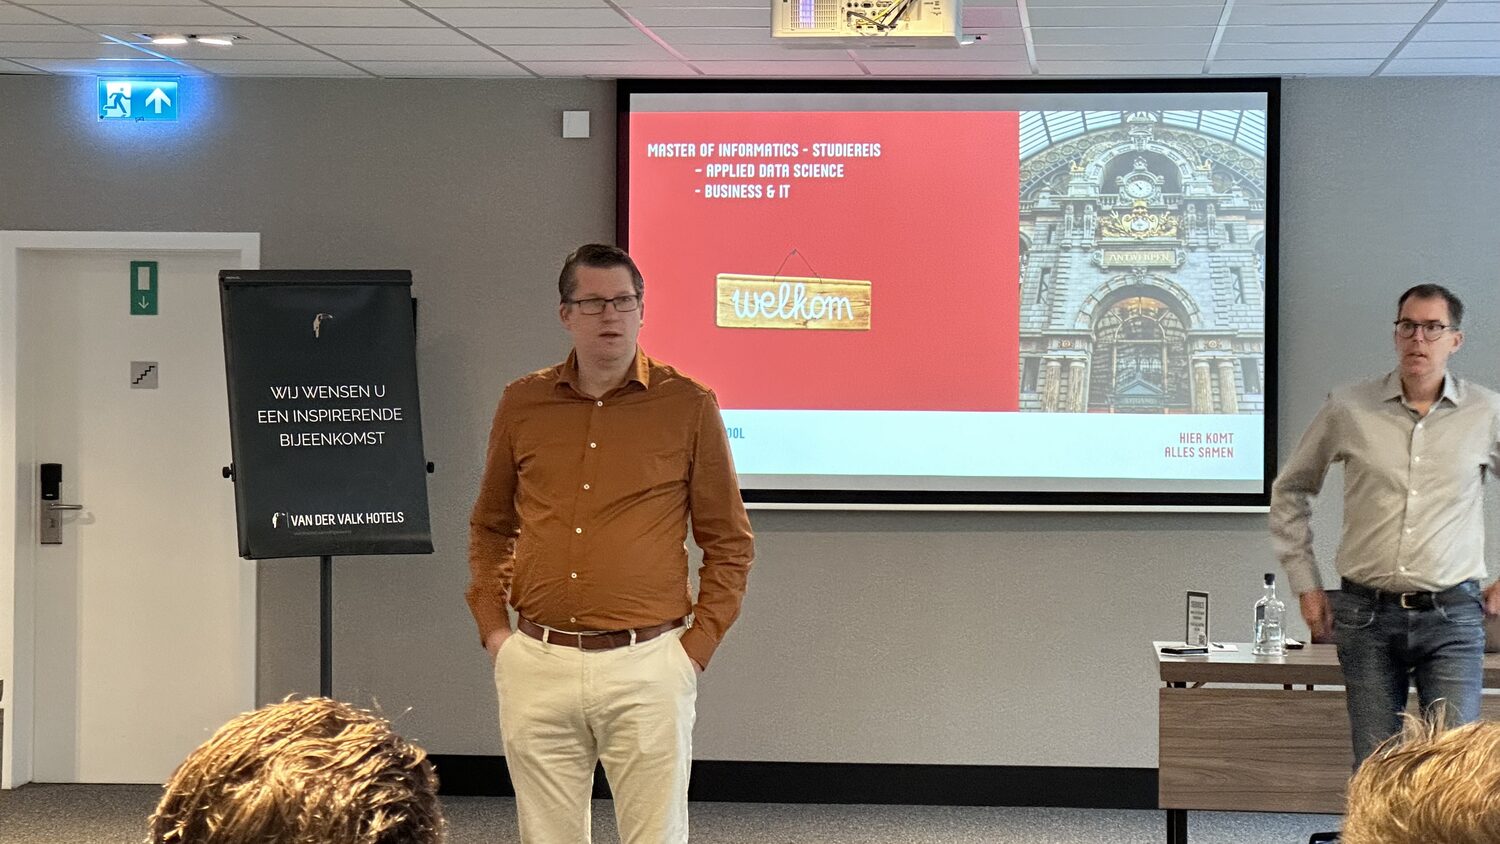
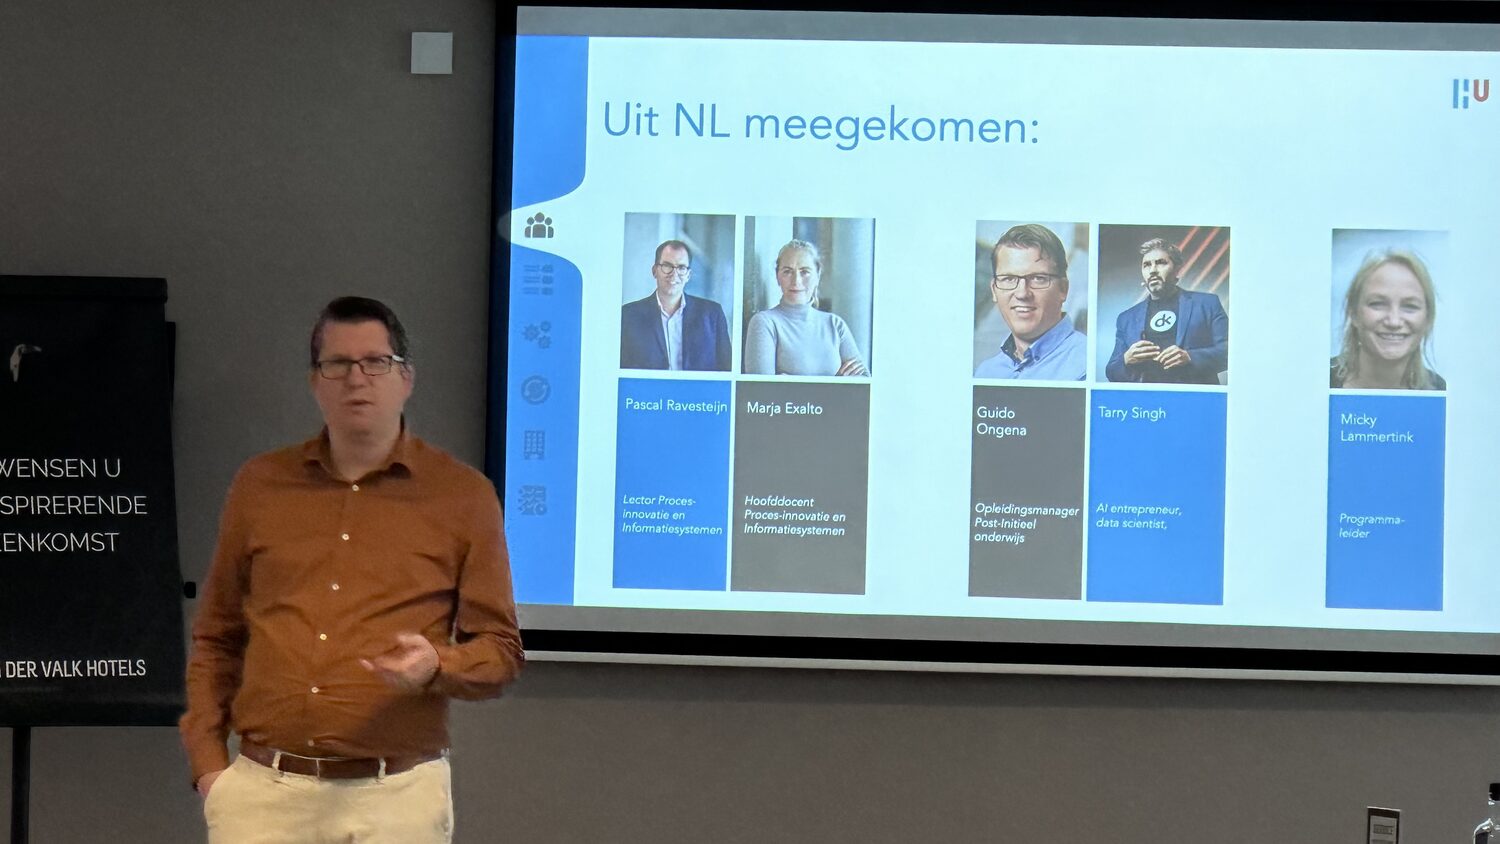
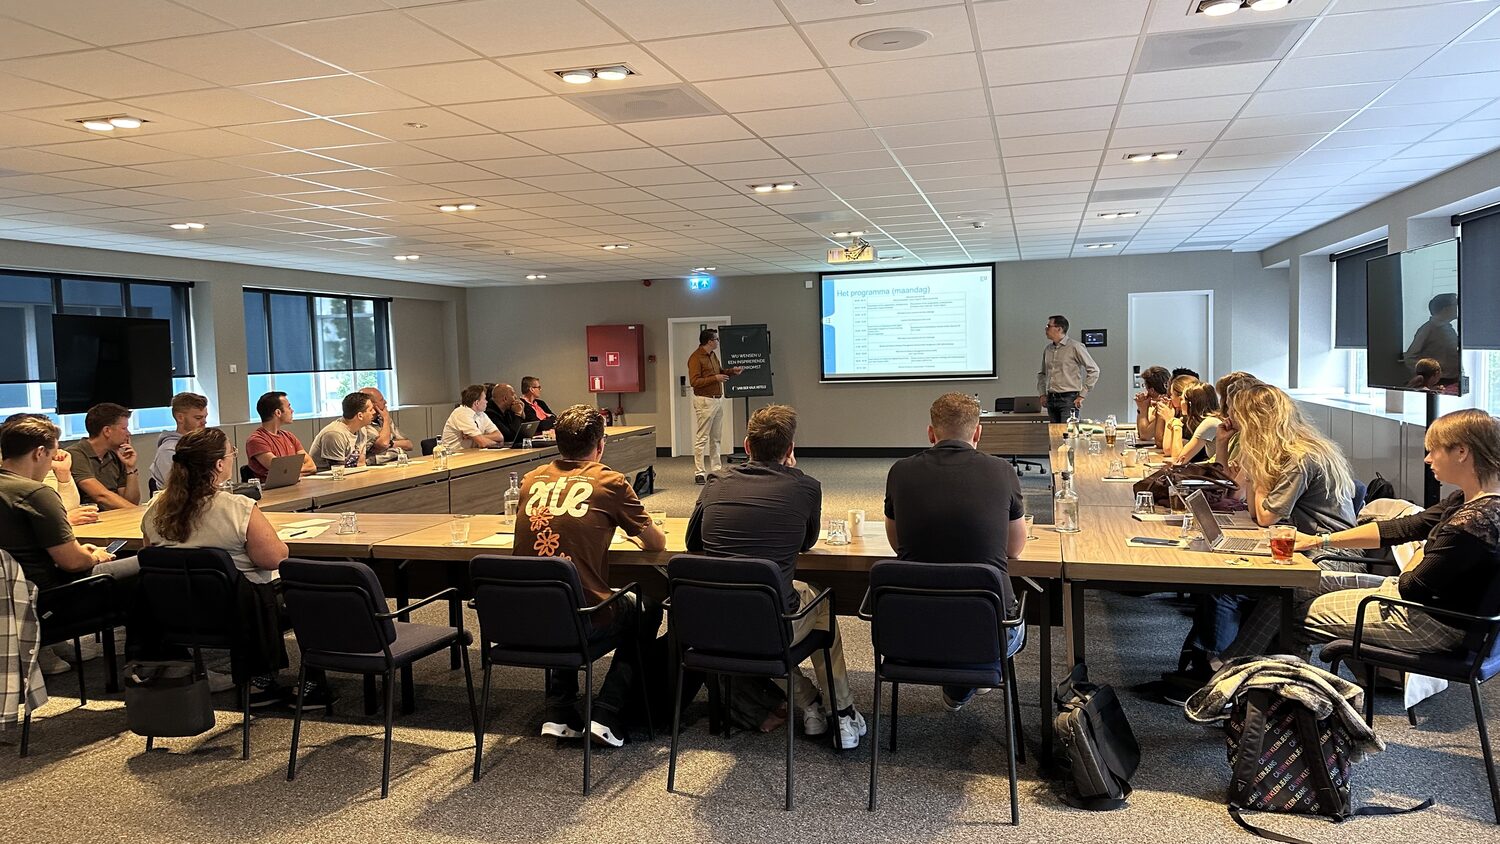
The study trip ran on 26 and 27 August 2024 in a meeting room on the eastern edge of Antwerp, a Van der Valk property whose flip board in the corner wished the group an inspiring gathering. The opening slide named the two tracks, Applied Data Science and Business & IT. A second slide, headed "Uit NL meegekomen", put five faces on screen: Pascal Ravesteijn, Marja Exalto, Guido Ongena, Tarry Singh and Micky Lammertink. Delegates filled a long U-shaped table by nine in the morning.
The Applied Data Science brief came from Data.be, and the practical terms went up on the same slide as the challenge. Sign the NDA. The data arrives by mail. Experts are reachable over Zoom. The dataset covered every registered Belgian company across the previous decade: VAT number, zip code, NACE code, company type, start and end dates, status and legal situation, then annual figures for headcount, turnover, current assets, gross operating margin, tangible fixed assets, equity, profit and loss, current ratio, net cash, self-financing degree, return on equity and added value. Three problems were on the table. Build a company health score from 0 to 100. Cluster companies and find lookalikes. Detect financial anomalies and raise risk alerts.
The Business & IT track worked a different problem, circularity in housing construction, and its teams pitched building diagrams rather than distributions. Reference material sat alongside for both groups: the National Bank of Belgium's full model for annual accounts of companies with share capital, its 2014 filing guide, an April 2022 code list with translations, and a Dutch primer on ratio analysis covering liquidity, efficiency, solvency and return.
On the evening of 26 August the group sat in a room at Antwerp Management School for a data science session on data architecture, data integration and data deployment, given by Edzo A. Botjes. The next morning the cohort was back at the laptops, four and five to a table, some of them working under the mural on the far wall.
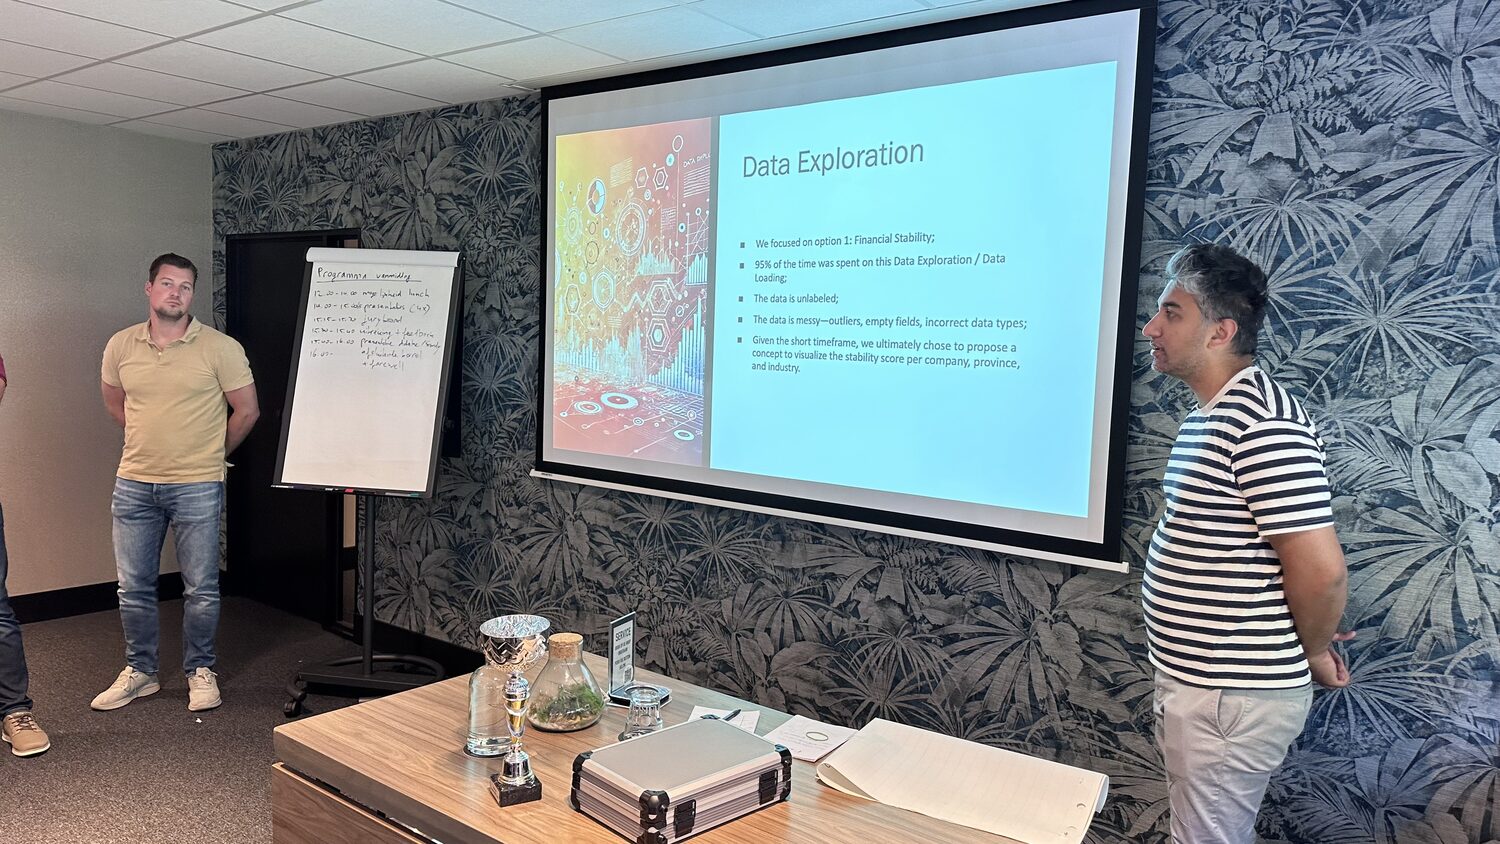
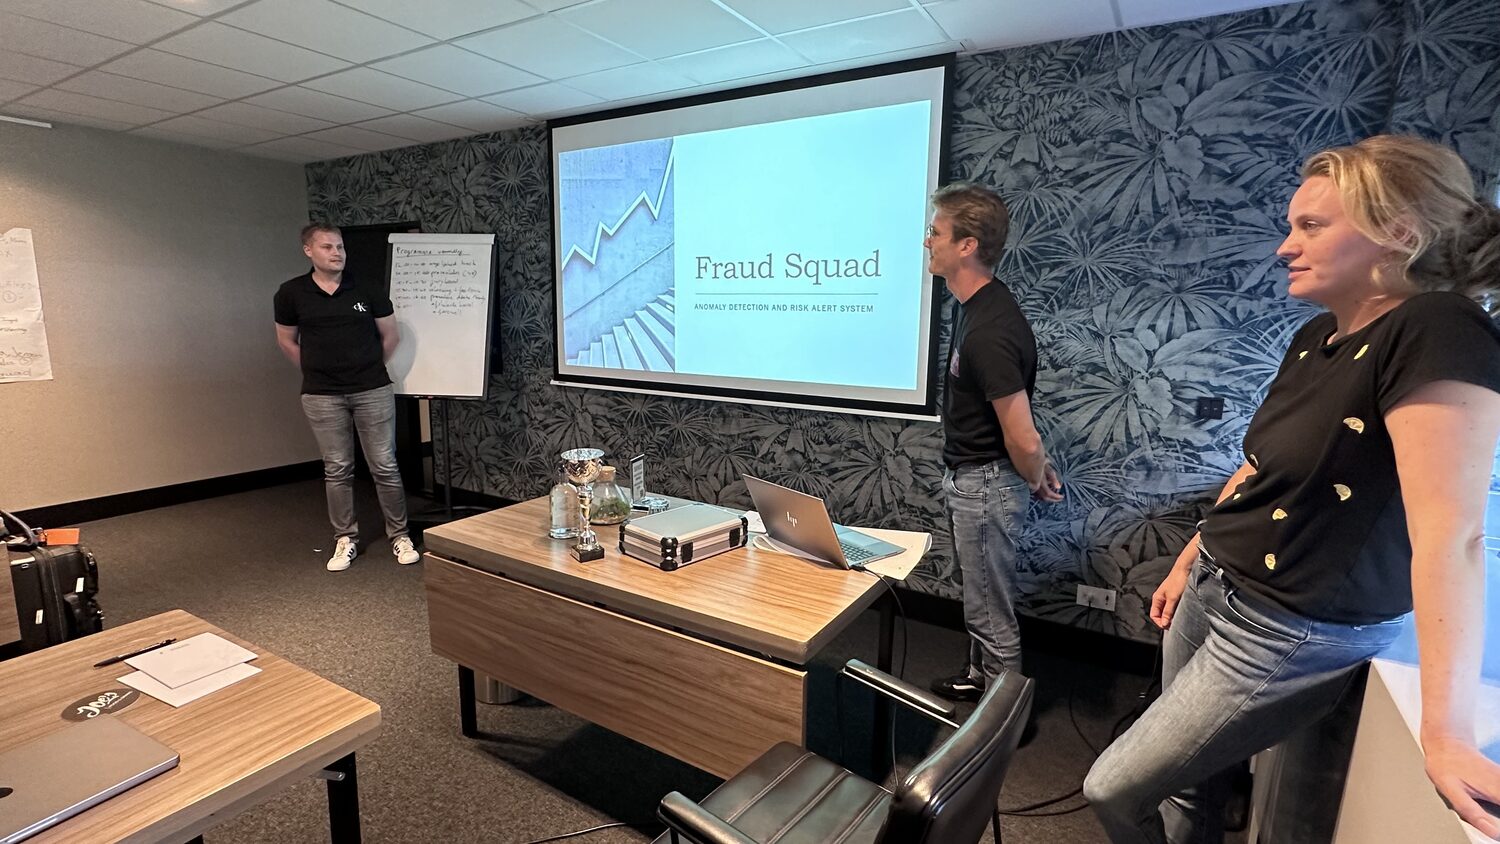
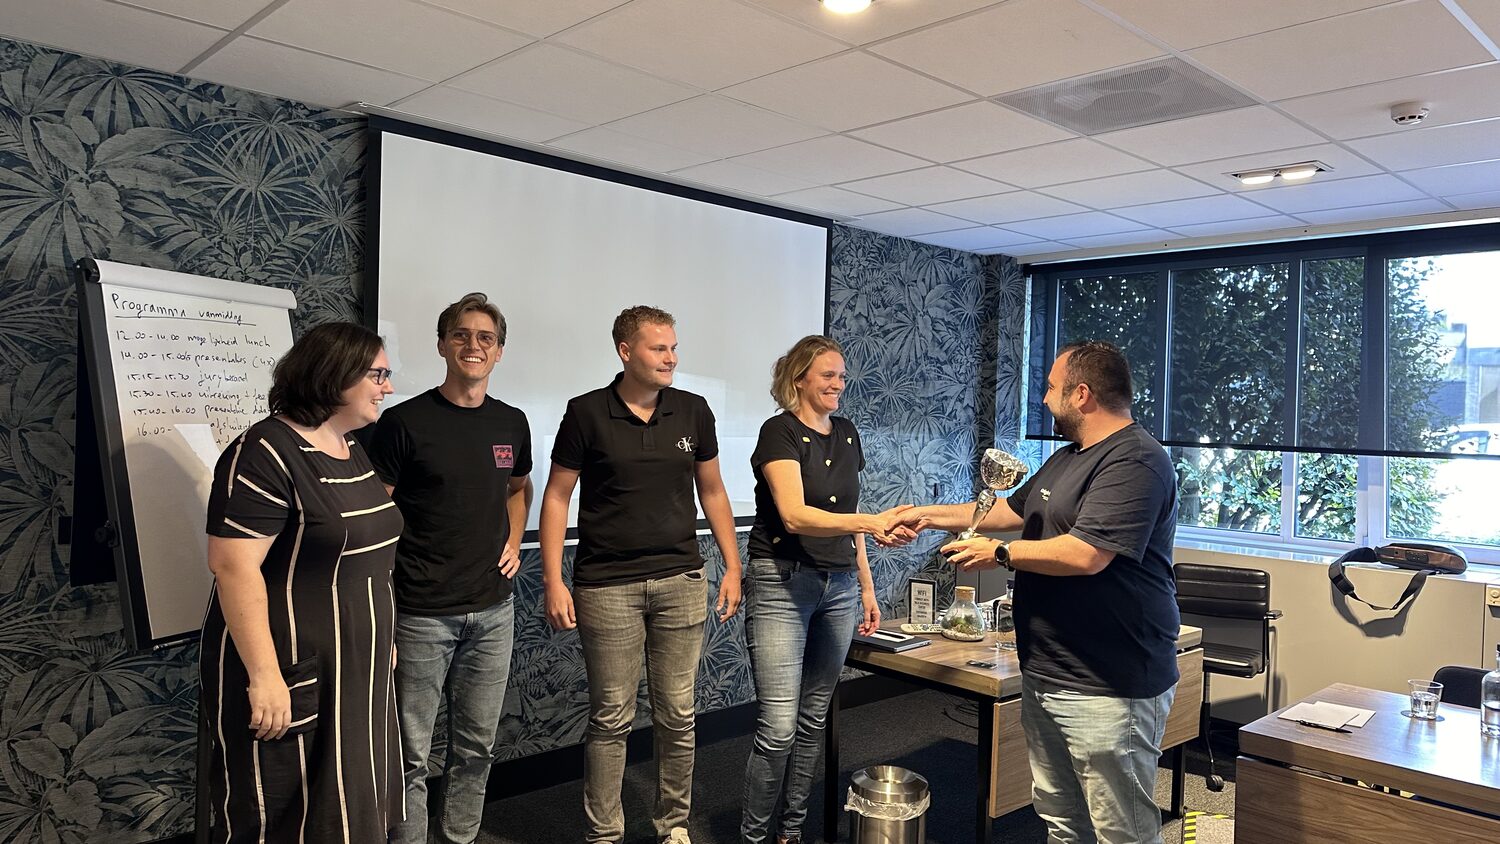
Day two ran to a flip chart timetable in the room: lunch until two, four presentations, fifteen minutes of jury deliberation from 15:15, then the handover. Teams took the screen with their own titles and their own charts. One called itself Fraud Squad. Another walked the room through a scatter plot and a bar chart of company counts by year. The trophy changed hands at 15:54, and the cohort lined up on a staircase for a photograph before the room emptied.
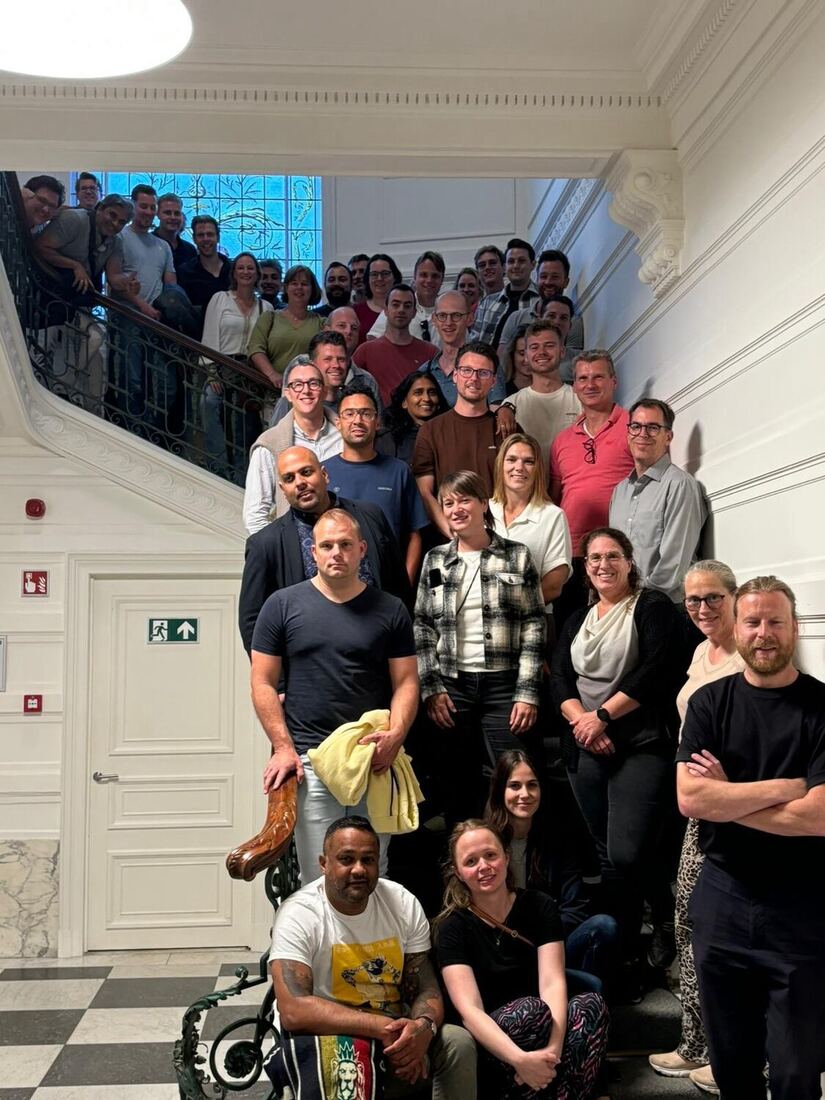
The full cohort gathered on an ornate staircase for a group photograph. 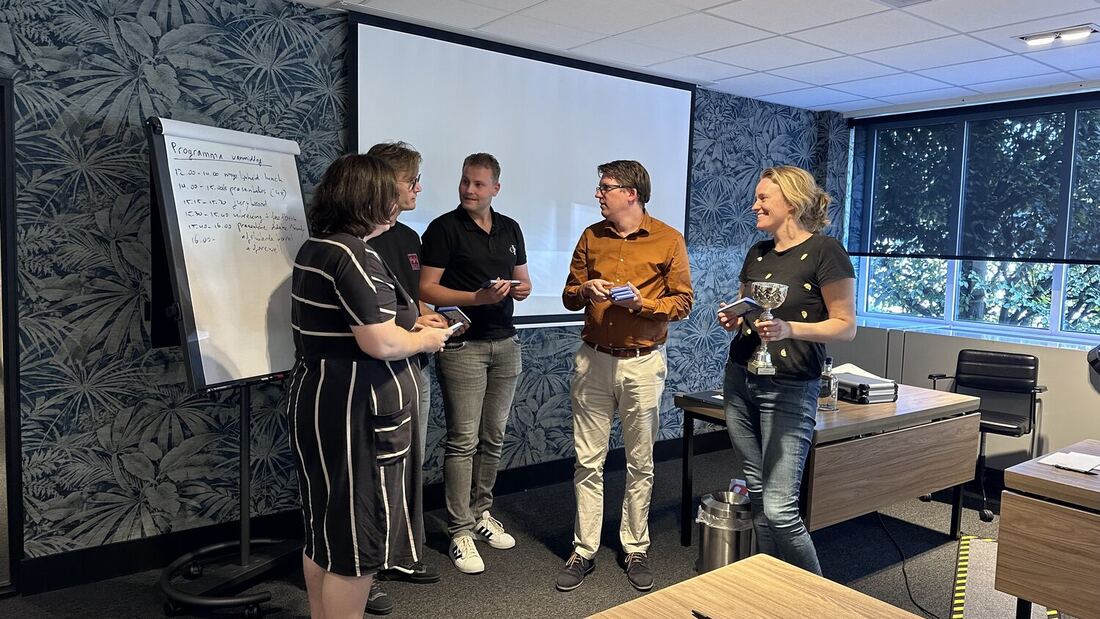
Four people hold trophies at the front of the room beside the programme flip chart. 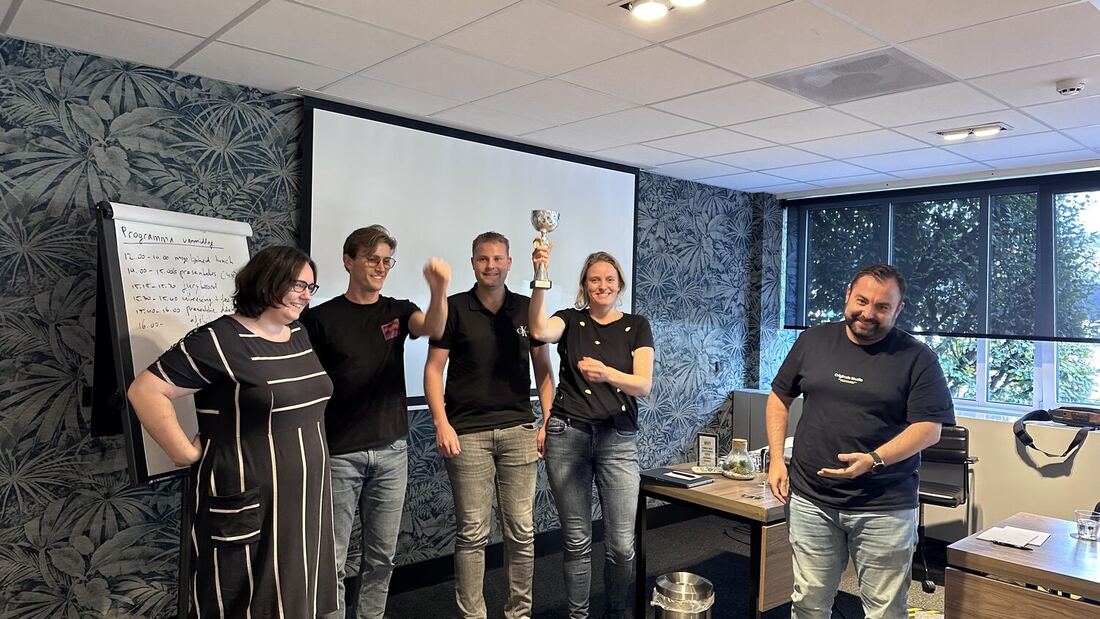
A team member raises the trophy while the rest of the group applauds. 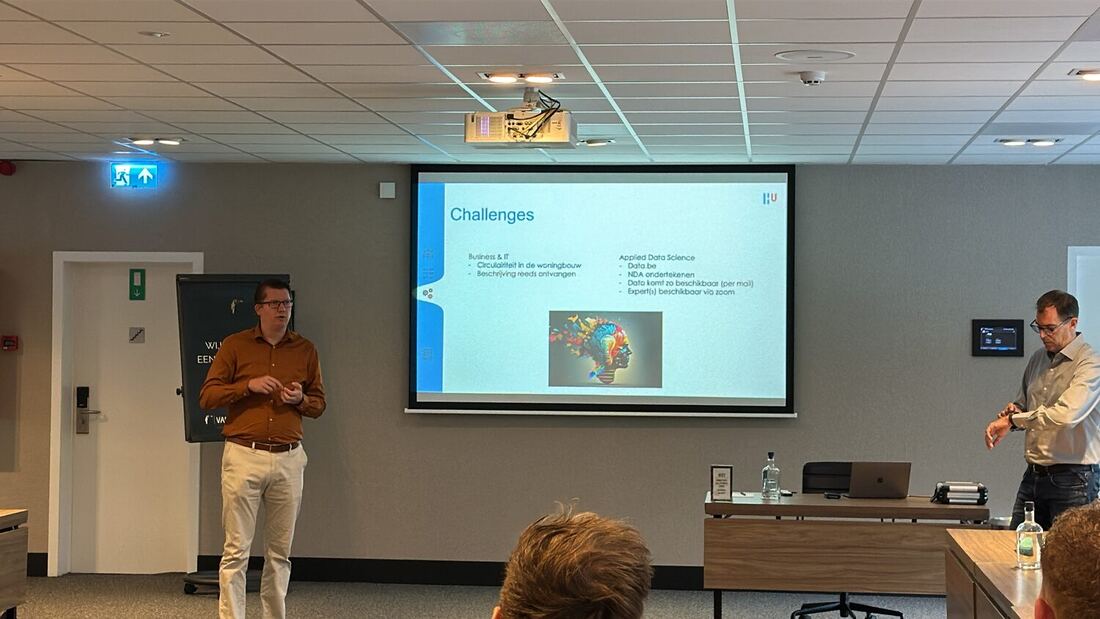
Two presenters stand beside a screen showing a slide headed Challenges, listing the Business and IT brief and the Applied Data Science brief with Data.be. 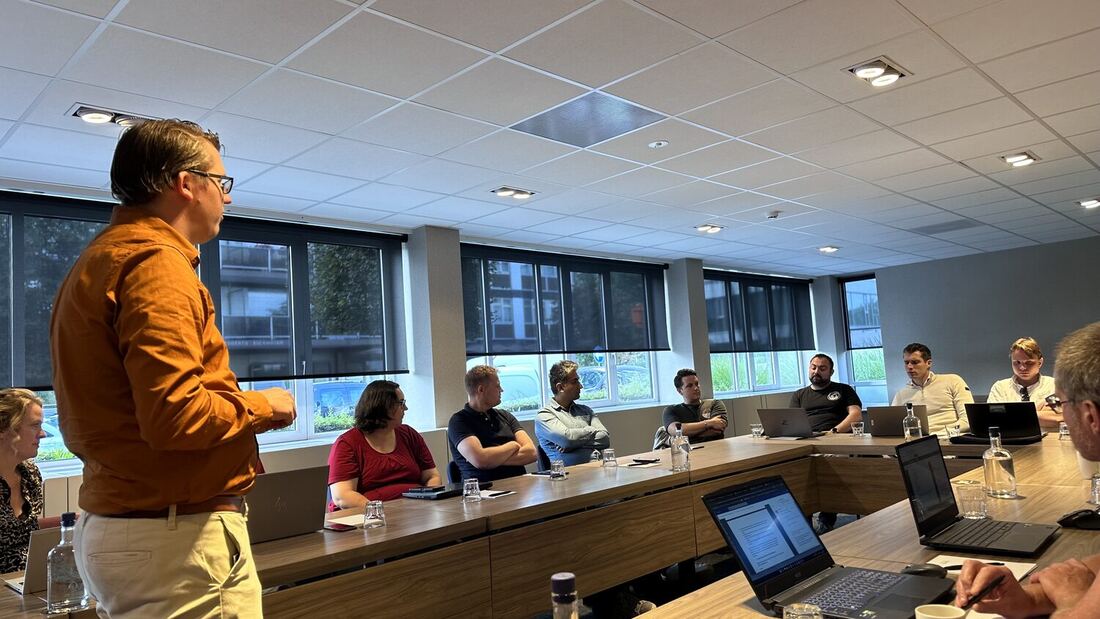
The presenter stands in the foreground addressing delegates seated along the table with laptops open. 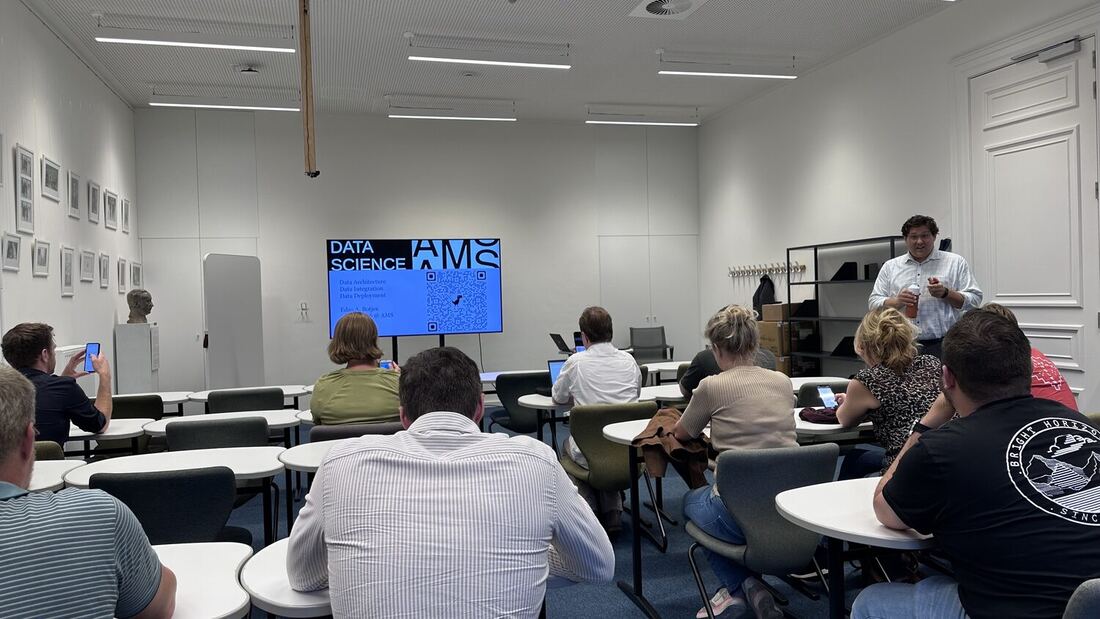
An audience seated at small tables faces a screen reading Data Science AMS, advertising a talk on data architecture, integration and deployment. 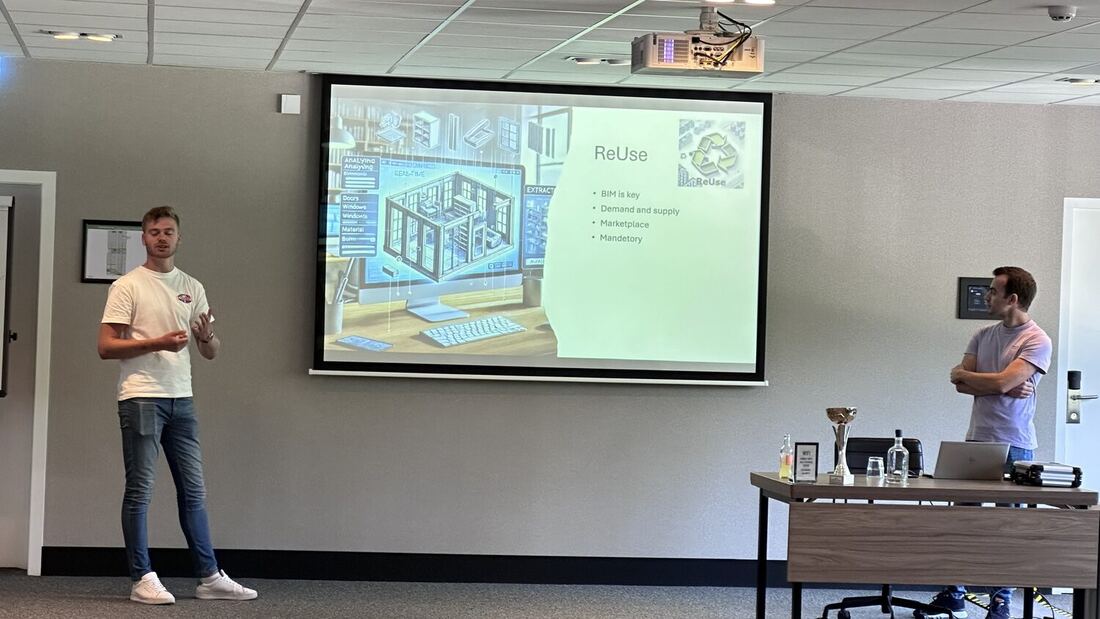
A student presents a slide showing a housing block diagram for the circularity brief. 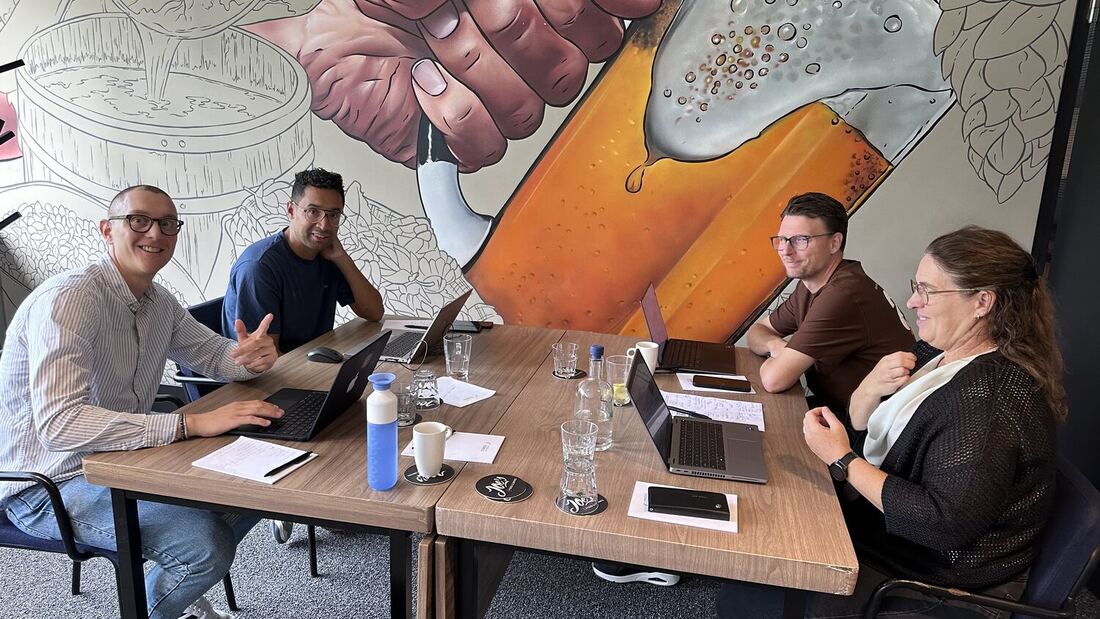
A group of delegates works at a table beneath a large wall mural. 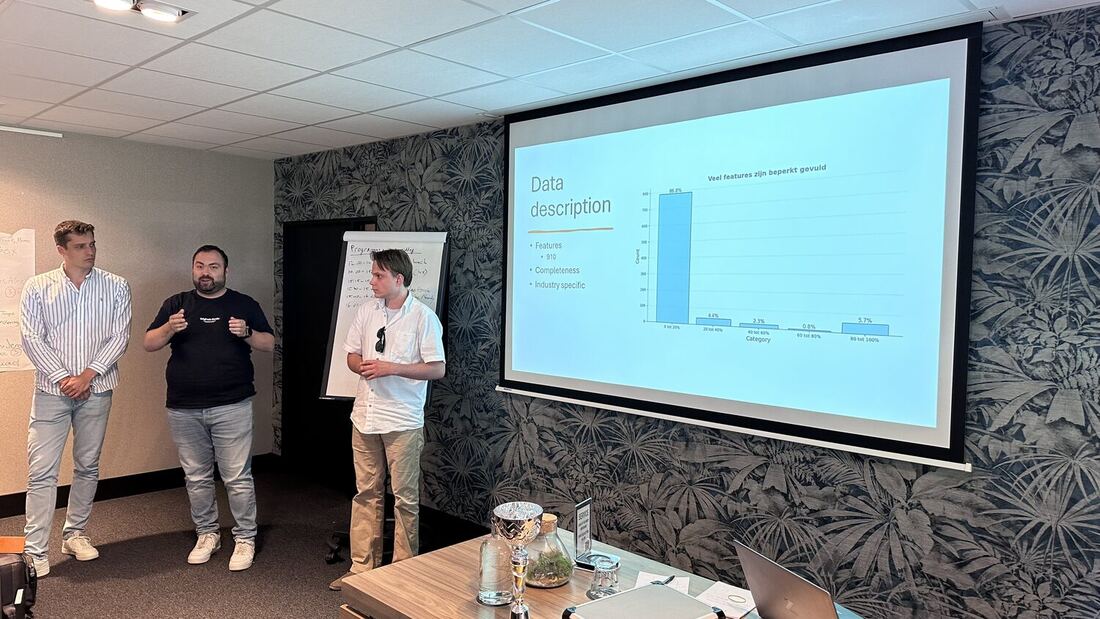
Three students present a bar chart of their findings to the room. 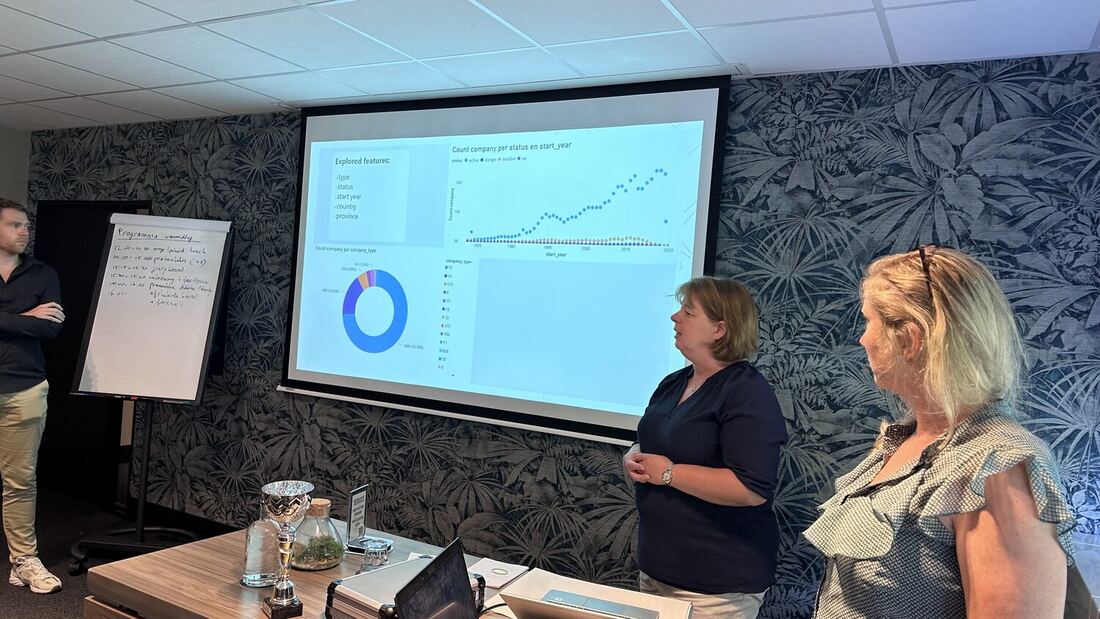
Two students present a slide combining a donut chart and a trend line. 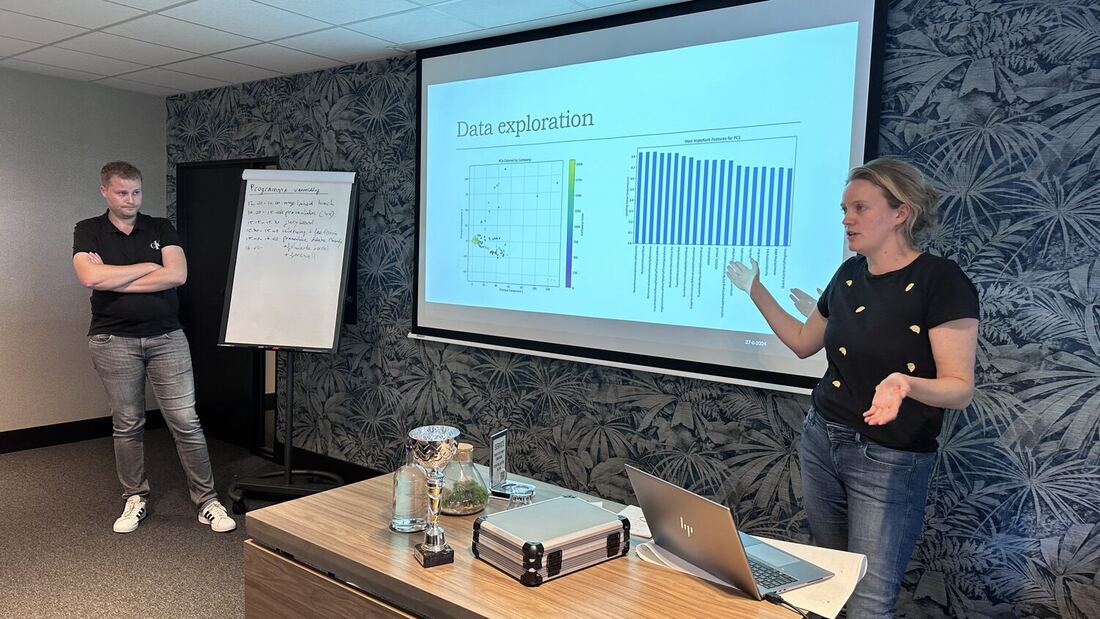
A student points at a data exploration chart on screen while a teammate stands alongside. 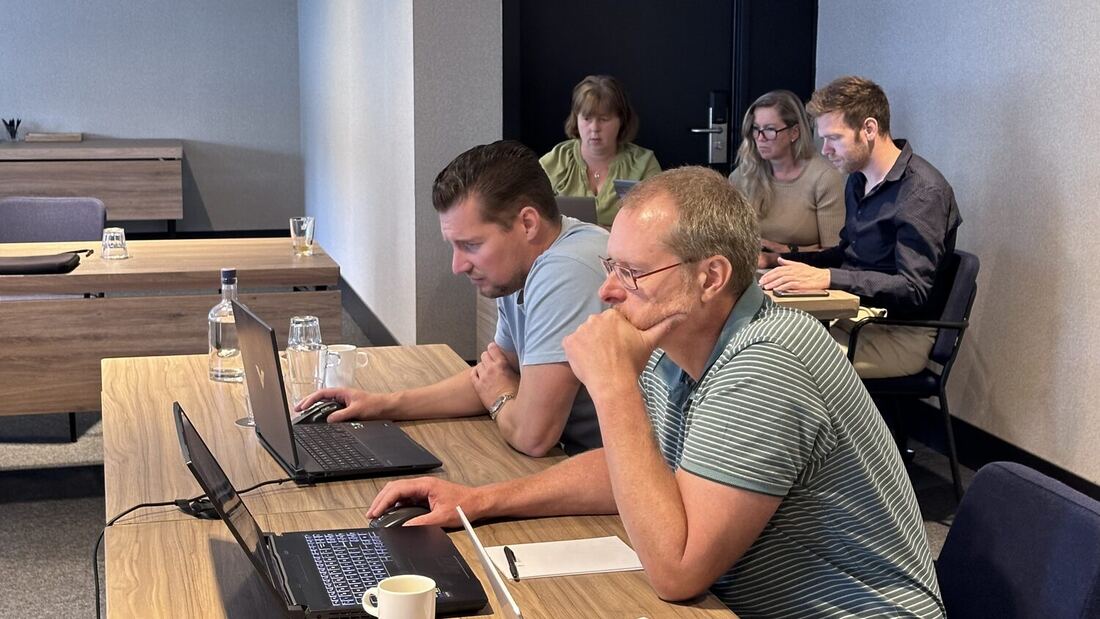
Two delegates work at a laptop with others at the table behind them. 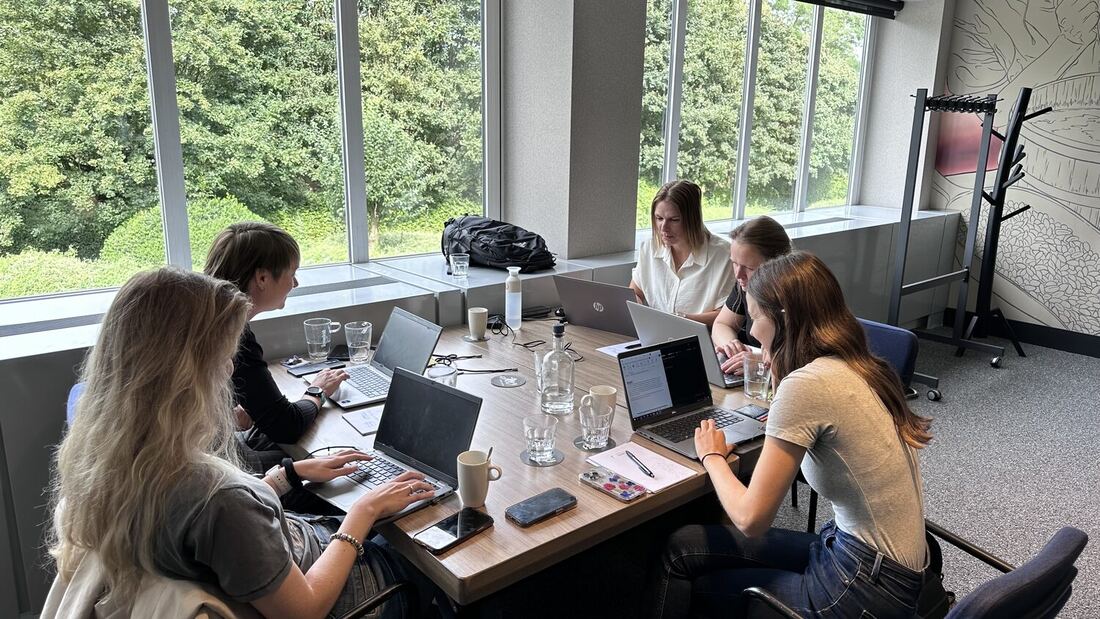
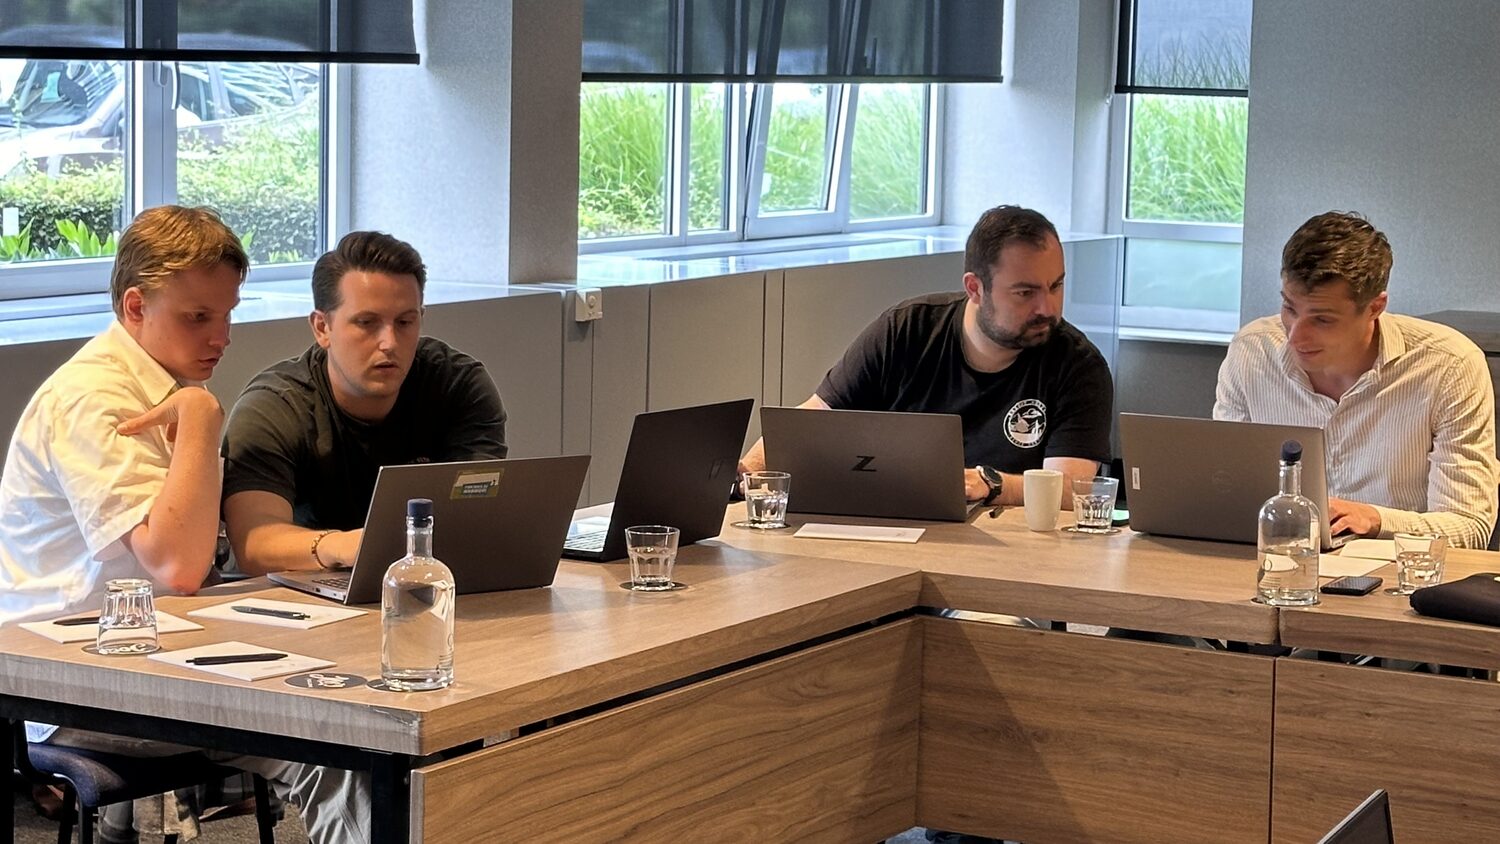
Delegates at laptops along a table beside the windows. 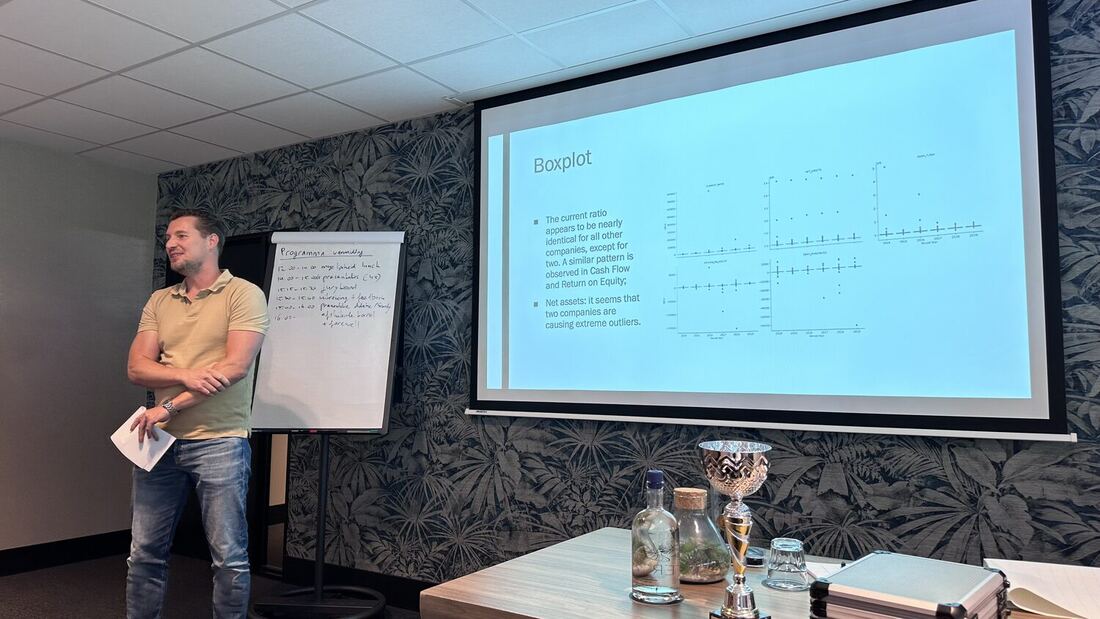
A presenter at a large screen showing a table of results, with a flip chart alongside. 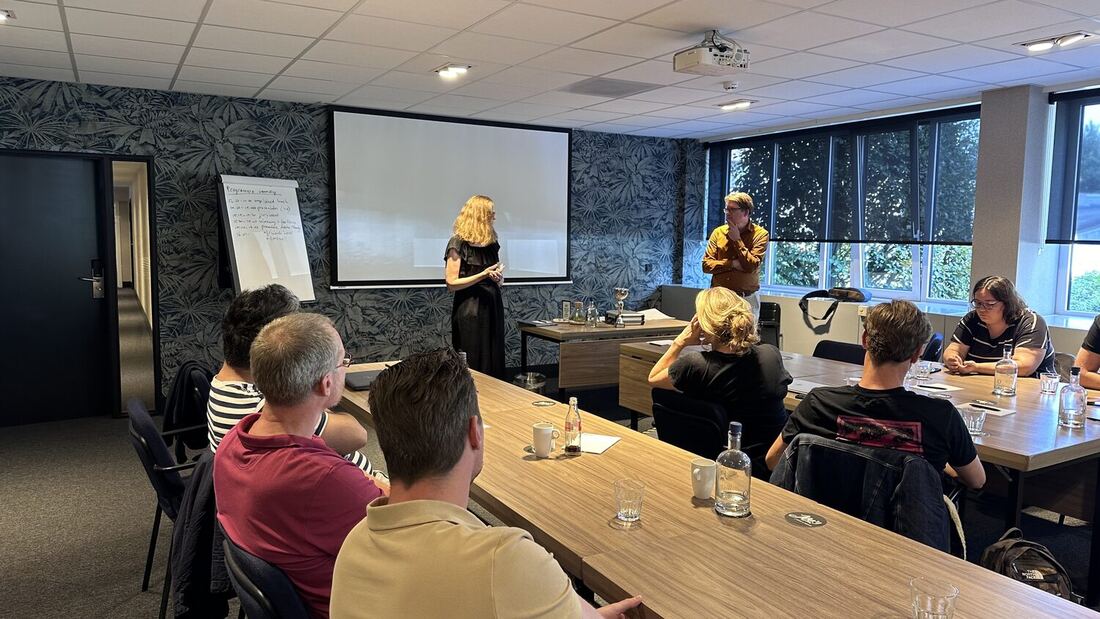
Delegates seated at the tables listening to a team present. 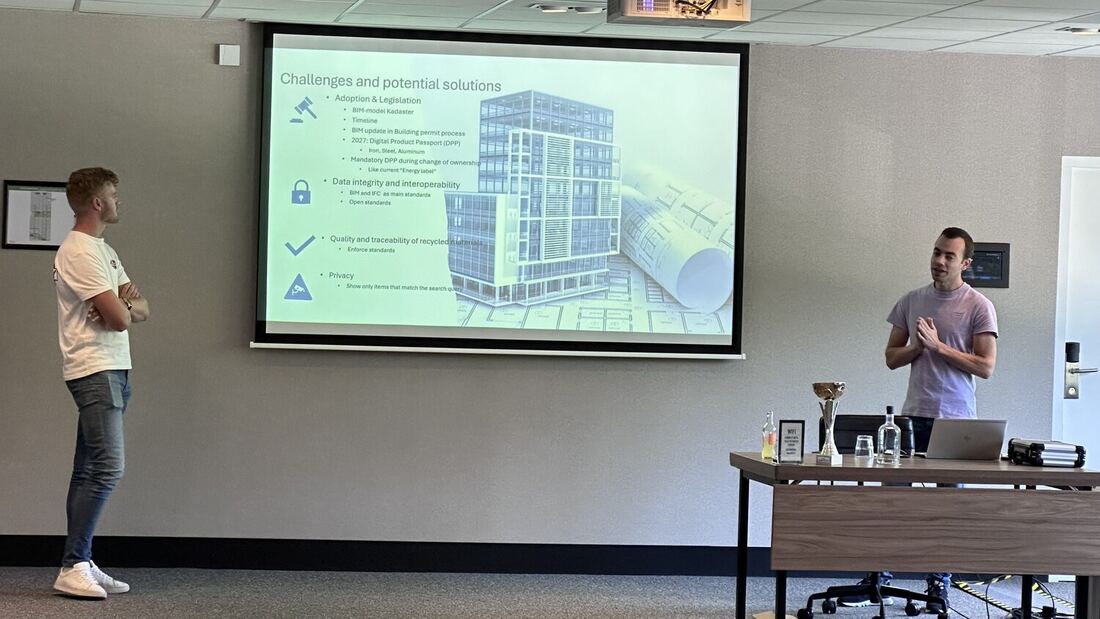
Two students at the screen presenting the circularity in housing construction work. 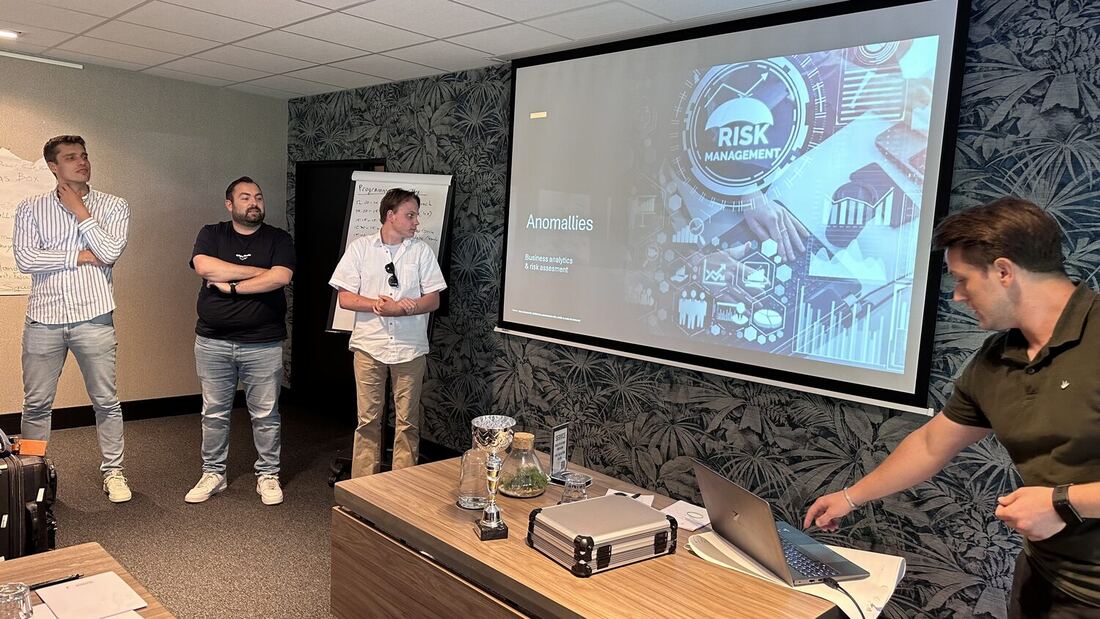
Three students stand at the front of the room as their title slide plays on the screen. 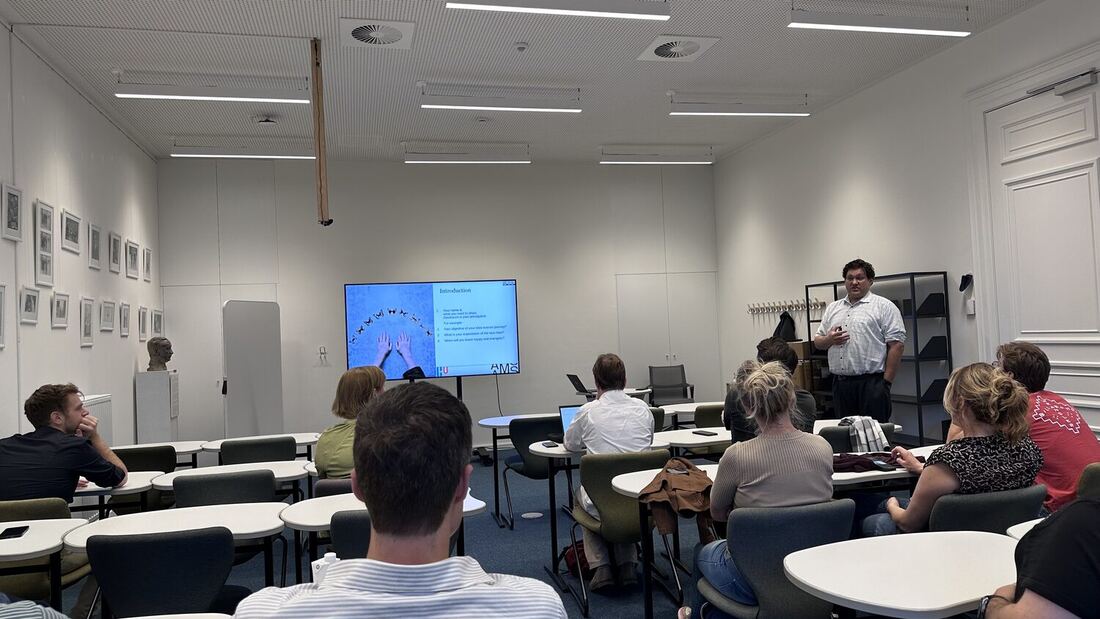
Wider view of the Antwerp Management School room with the speaker standing at the front. 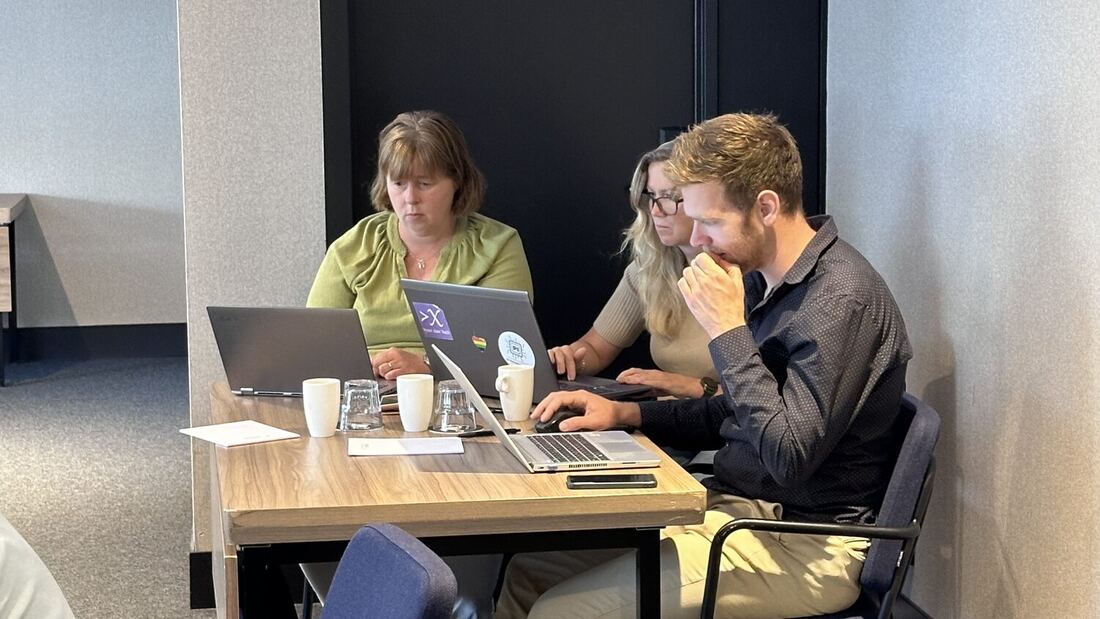
Three delegates work together at a laptop in a corner of the room. 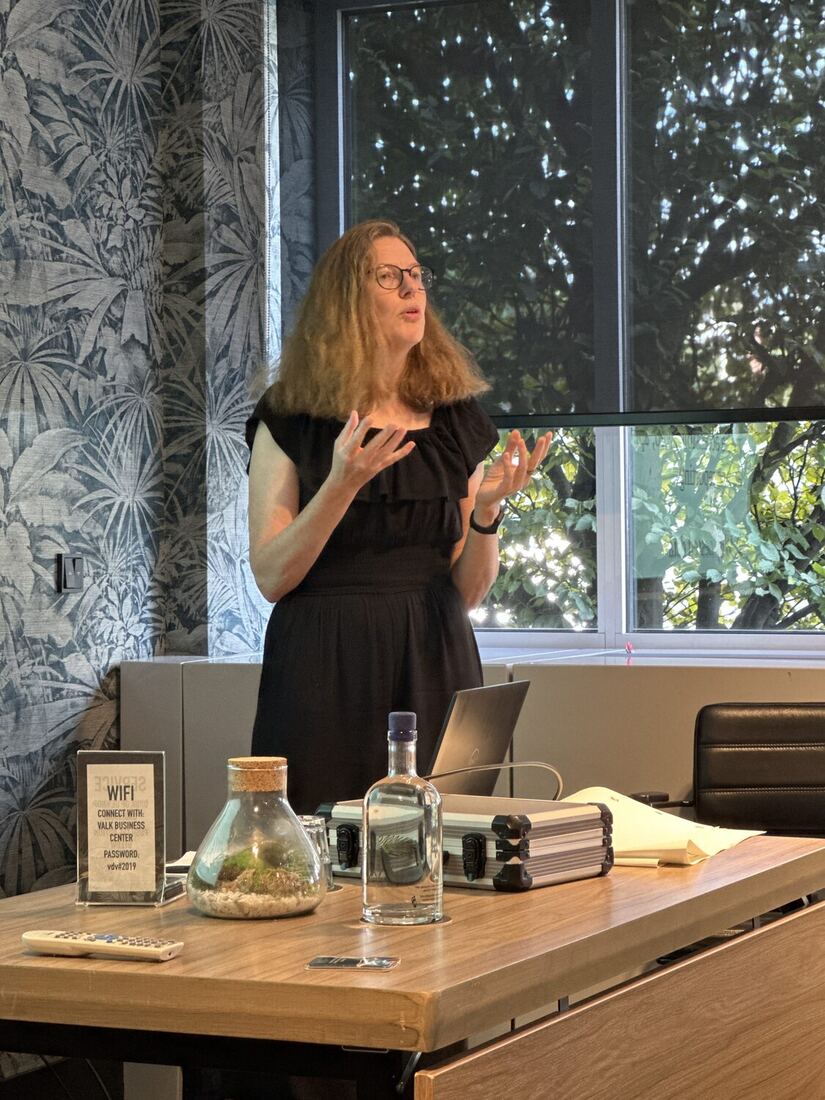
A presenter speaking at the front of the room beside the windows. 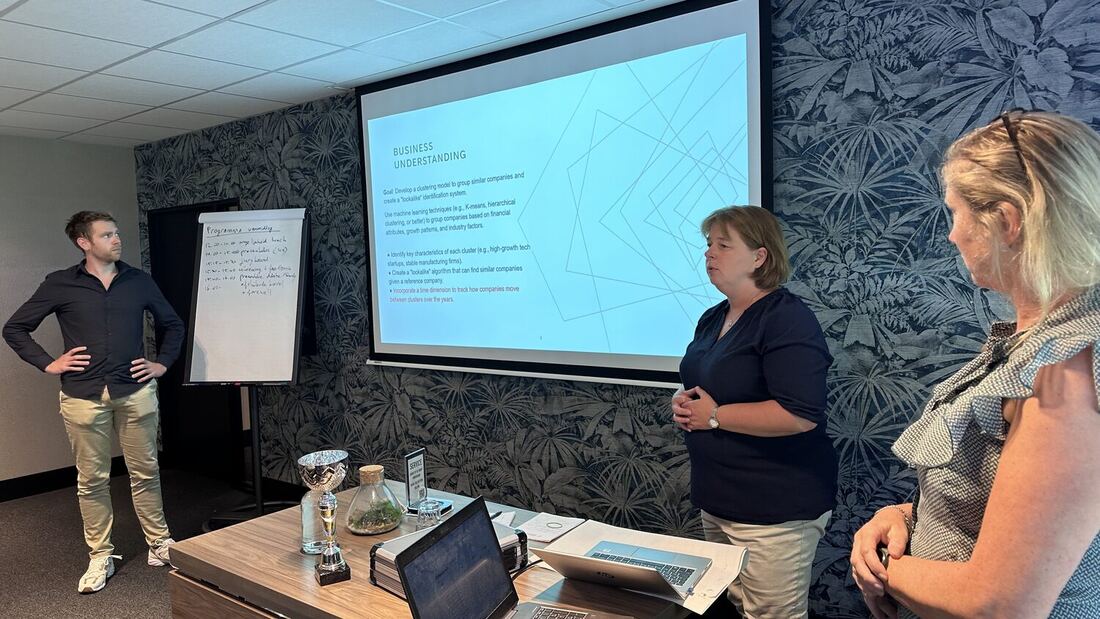
Two students present their approach at the screen. 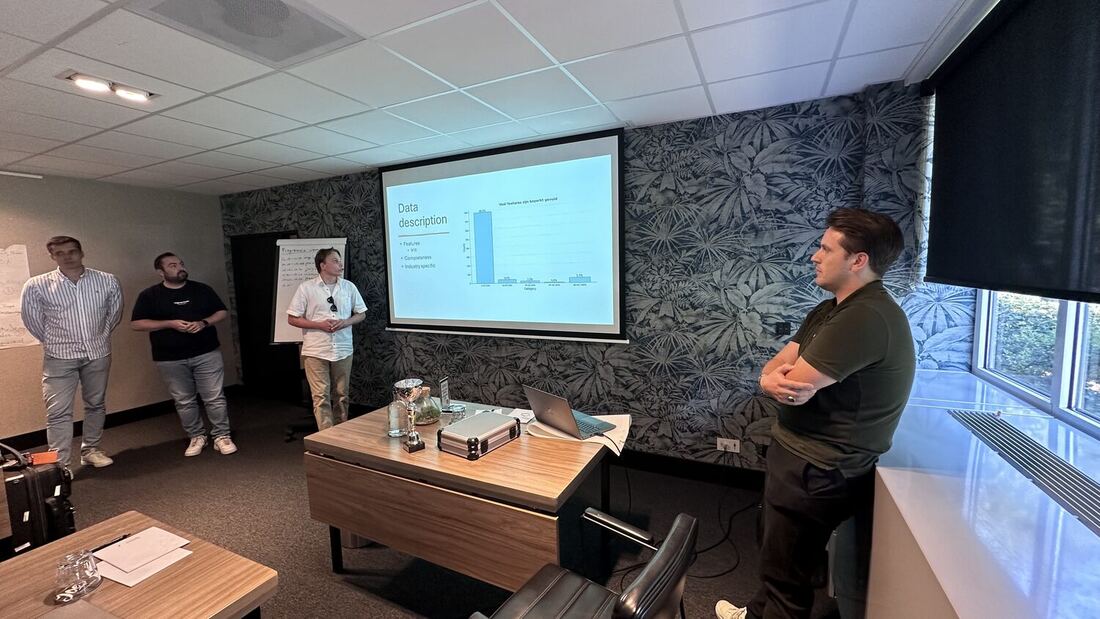
A student talks through a chart on the screen while a teammate looks on. 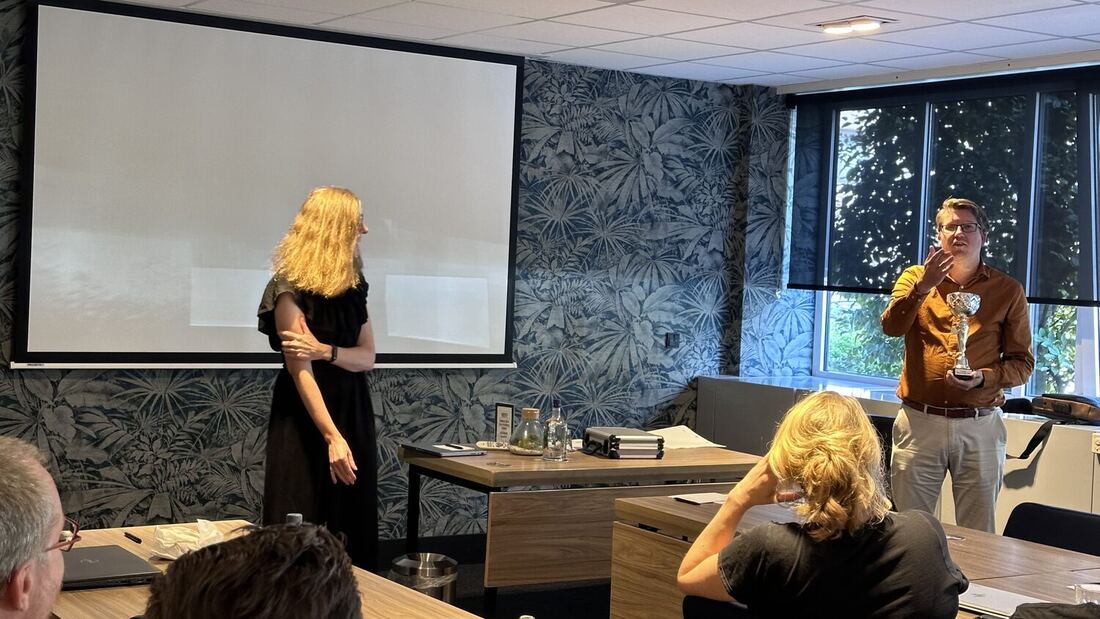
The room seen from the back during a presentation, with speakers at either side of the screen. 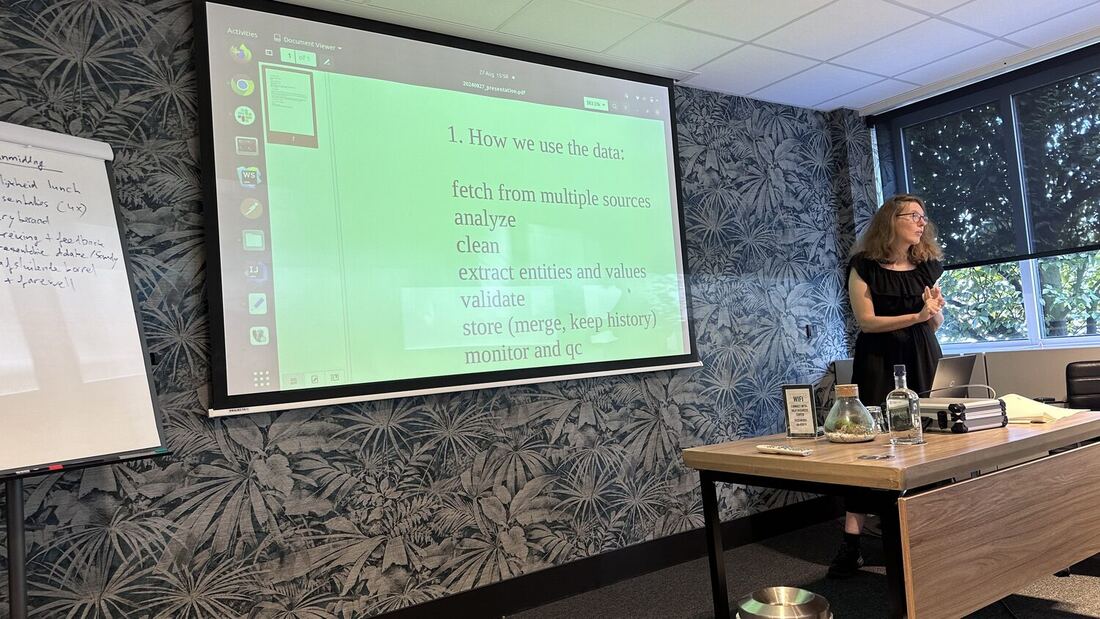
A presenter beside a green slide of written notes at the close of the day. 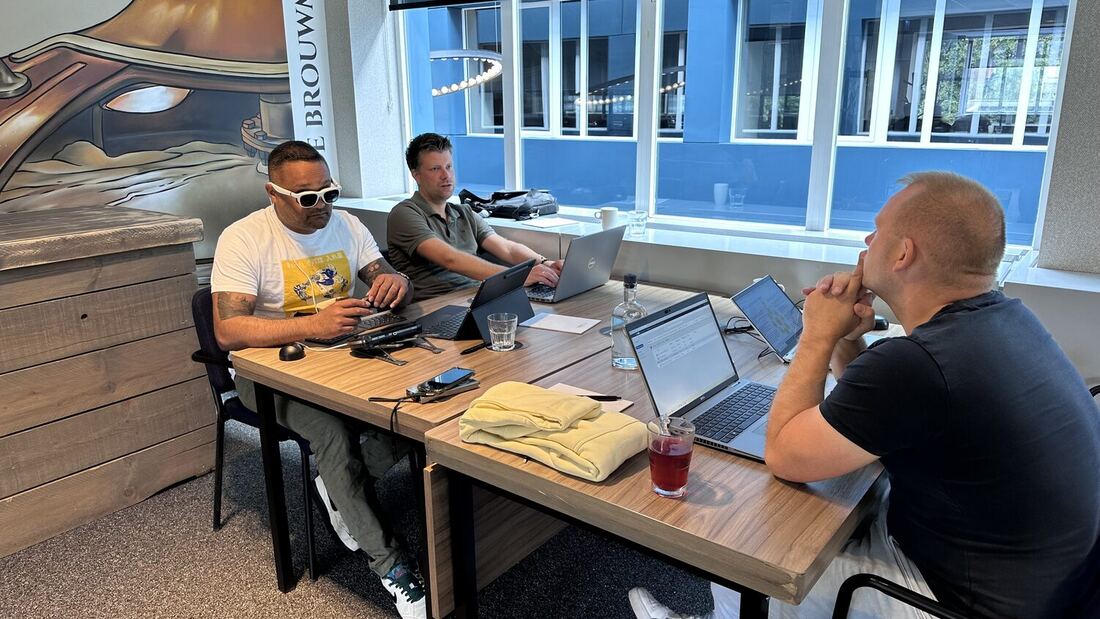
Three delegates at a table with laptops under the mural. 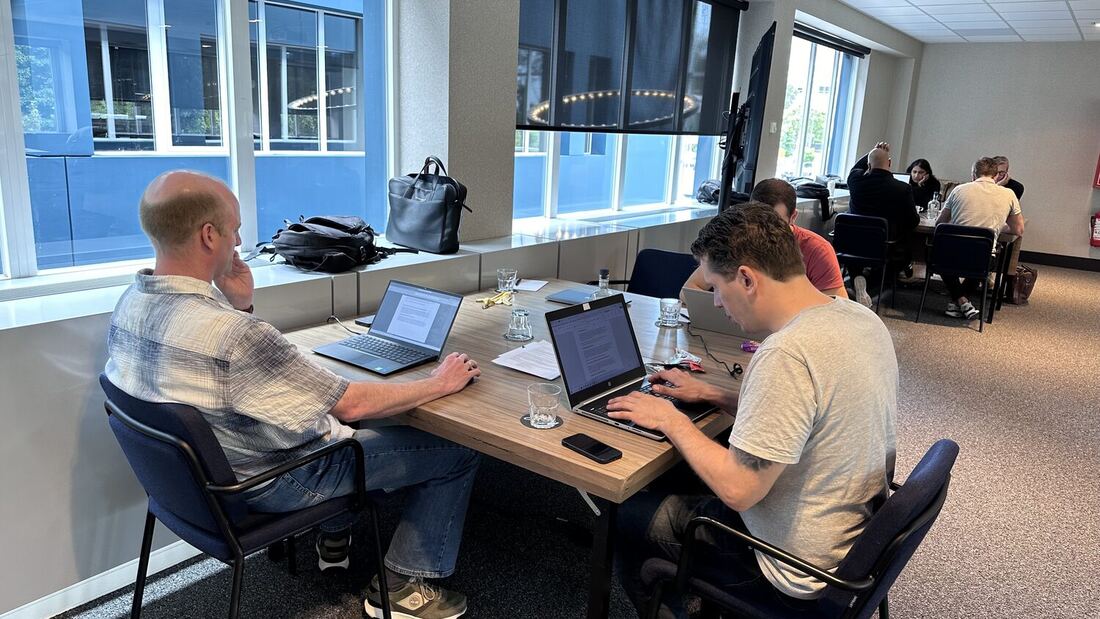
Delegates at laptops beside the windows during the working session. 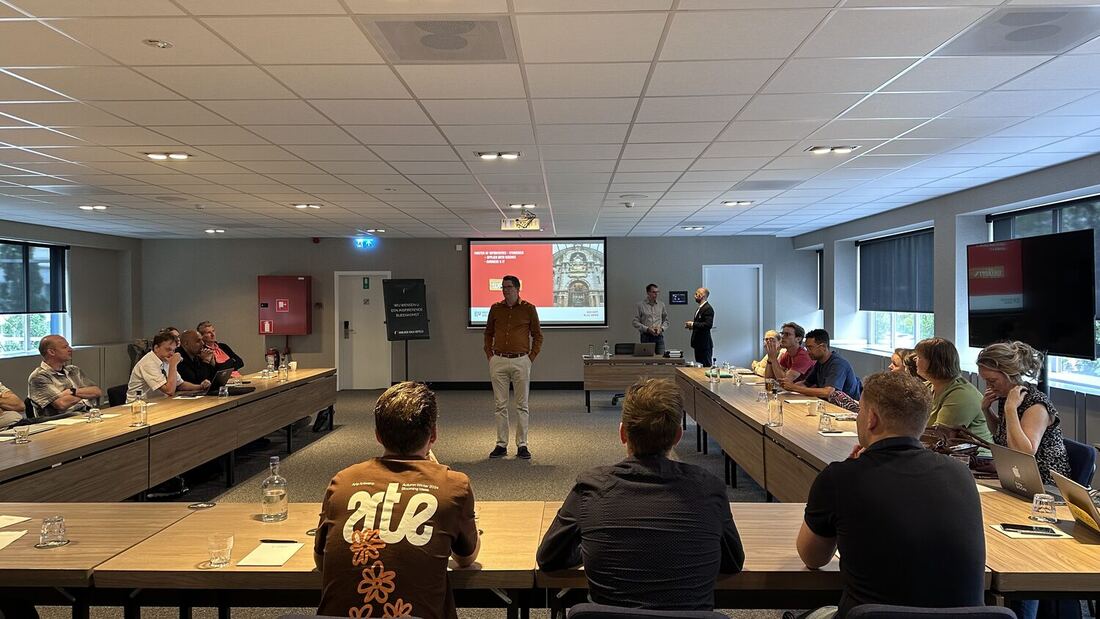
Wide view of the meeting room with delegates seated around the U-shaped table facing the screen. 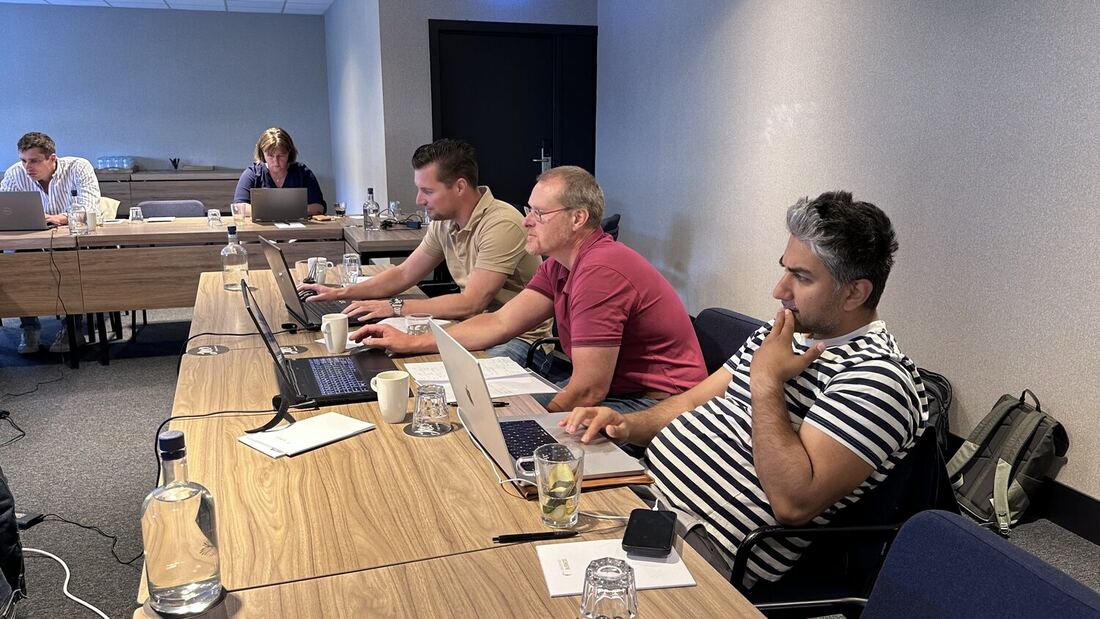
Delegates seated along the table with laptops open during a working session. 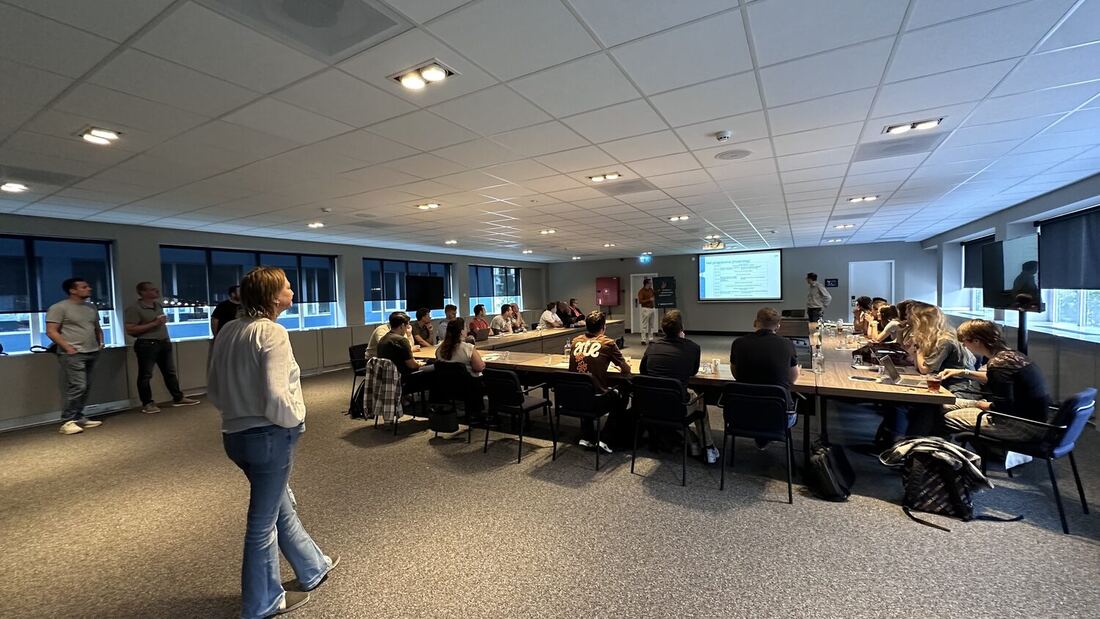
The room from the side, delegates at the table with the screen lit at the far wall. 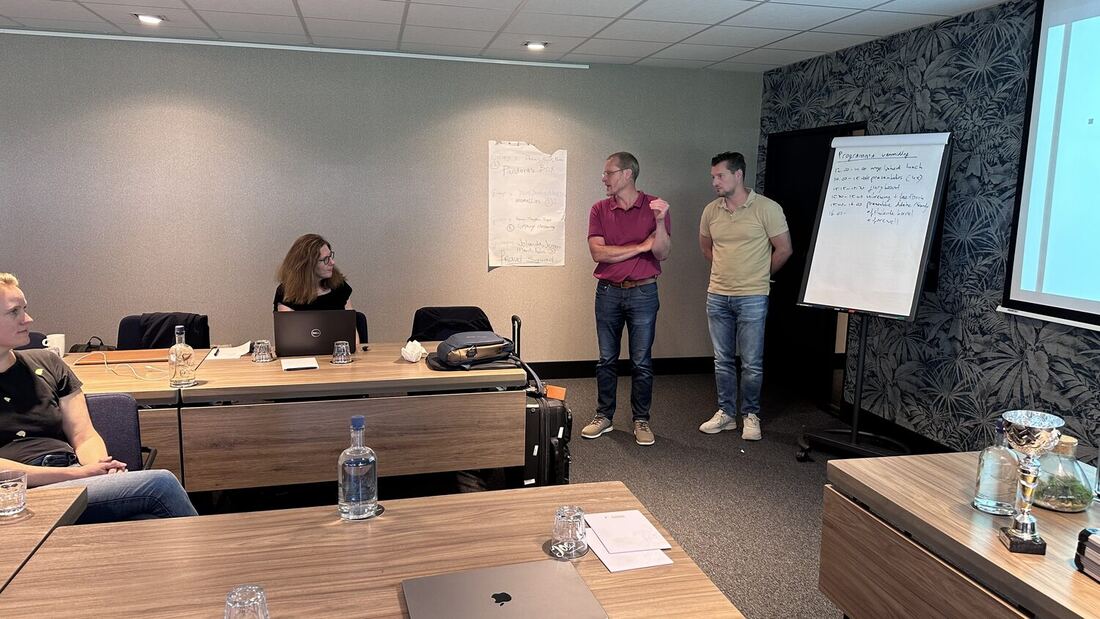
A delegate at the table while two others work at the flip chart. 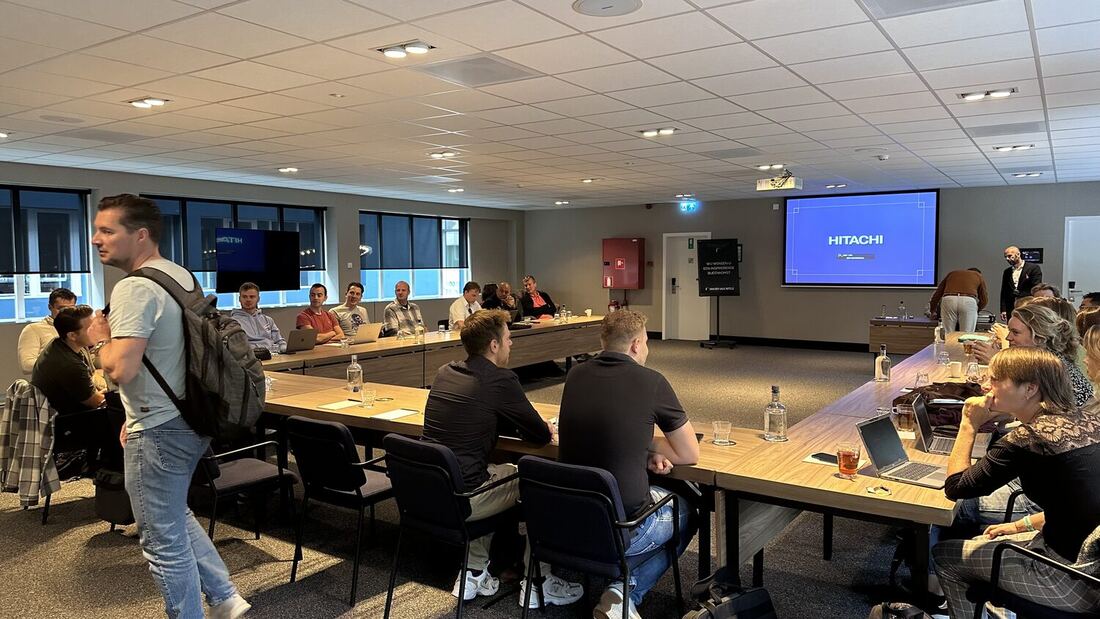
Delegates settle into the room laid out with a long U-shaped table before the session starts.
Belgian Business Intelligence Hackathon: three tracks over two days, with the Data.be dataset listed field by field.
National Bank of Belgium full model for companies with share capital, the reference schema for the dataset.
April 2022 spreadsheet mapping annual accounts codes across languages.
Dutch language user guide to the annual accounts filing format.
Dutch guide to liquidity, efficiency, solvency and return ratios, used as background for the health score work.
